Manoeuvring Feasibility Study for LNG Vessels
Year : 2014
Client : WesPac Midstream LLC
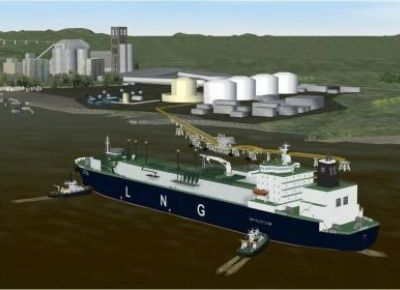
WesPac was considering the construction of an LNG export terminal on the south shore of the Fraser River in the vicinity of Tilbury, BC, Canada. As part of the project’s preliminary analysis and in conjunction with the application for various approvals and certifications, a manoeuvring study was commissioned. WesPac requested the MSRC’s service to assess the navigational feasibility of transiting LNG vessels with capacities of 60,000 CFM and 80,000 CFM, loaded to a maximum draught of 11.0 metres to and from the proposed dock.
The study took place at the MRSC’s facilities and consisted of a series of 31 manoeuvres run on the full mission simulator, using loaded and ballasted membrane LNG ships, each assisted by either two or three Z-drive tug boats depending on test conditions (4 interactive Bridges). All runs were conducted with two Fraser River pilots.
The MSRC’s ship modelling team created six specific models of the vessels that will visit the WesPac Terminal. MSRC’s own database development tool was used to modify a high-fidelity 3D geographical area model to include the new dock and the proposed bottom dredging work. Electronic Navigation Charts were used for geo-referencing all pertinent aspects of marine navigation: bathymetric contours (including drying areas), spot soundings, terrain elevation, coast line and man-made structures. CAD drawings of the proposed berth were used to position and design the dock structure and to reflect post-dredging bathymetric conditions. Satellite imagery and local photography were used to ensure that the visual scenery yielded an accurate representation, including non-charted fixtures commonly used by experienced pilots.
The full range of river currents and water heights were modelled for both a typical winter condition (outflow of 700 m³/second) and early summer freshet conditions (outflow of 8500 m³/second). These water flow predictions were dynamic covering an entire 24-hour period, and included the vertical height of tide, as well as current direction and velocity values at horizontal levels for depths of 0.6, 2.1, 3.6, 5.1, 6.6 and 8.1 metres. This provided a realistic representation of the river water levels (height of tide) and current/tidal stream velocities at any point in the river during the entire transit window.